How to Customize and Export Live Financials Report With Inkle Books
Live Financials is where your startup's numbers sit in Inkle Books: cash movement, burn rate, runway, your Balance Sheet, Income Statement and Cash Flow Statement, all built from transactions that are already categorised and reconciled. This article covers how to read the Summary dashboard, choose which sections appear on it, and export any view when you need it outside the platform.
Help video: How to customize and export live financials report with Inkle books.
What is Live Financials?
Live Financials is a single section holding six views of your finances:
The word "live" is the important part. Because reconciliation, categorisation and journal entries all happen in the same system, these views reflect your current data rather than a snapshot someone exported last month.
Why customize the summary dashboard?
The Summary tab can show fourteen different sections, and no two founders want the same fourteen. Someone raising in the next quarter cares about cash movement and runway. Someone chasing collections wants AR Analysis and AR Aging at the top. A founder reviewing spend wants Top Vendors and the month-on-month expense breakdown.
Customising is also what shapes your export, since the export follows whatever your dashboard is currently showing. Setting up the dashboard once means every export after that arrives in the shape you actually use.
Where do you find Live Financials?
From the left navigation in Inkle Books, go to Financials and select Live Financials. You will land on the Summary tab.
Custom Reports and Financial Closing sit alongside it under the same Financials menu.
How do you read the Summary dashboard?
Step 1: Set your time period
At the top of the page, use the Showing summary for dropdown to pick your range, for example Last 6 months. The date range appears next to it (for example Dec 01, 2025 to May 31, 2026) so you can see exactly what is being measured. Everything below updates to match, including every comparison against the previous period.
Step 2: Read the three headline metrics
Cash Movement is the net movement of cash across your connected accounts for the period, with the percentage change against the previous period of the same length.
Net Burn Rate is your average monthly burn after revenue is taken into account.
Runway is how many months your current cash covers at that burn rate. If revenue covers your burn, this reads Infinite with a note confirming you are profitable.
Each metric carries an information icon with a short explanation of how it is calculated, so you can check the definition without leaving the page.
Step 3: Open the Cash Movement chart
Below the headline numbers, the Cash Movement chart plots three things per month: Outflow, Inflow and Net change. Use this when a burn or runway figure surprises you, since it shows which specific months moved the number and whether the cause was money in or money out.
Step 4: Work down the rest of the dashboard
Profitability gives you revenue, expense and profit for the period, each with its change against the previous one.
Revenue Analysis, MoM Revenue Breakdown and Top Customers show where income is coming from and how it has moved month to month.
Spend Analysis, MoM Expense Breakdown and Top Vendors do the same for outgoings.
AR Analysis, AR Aging, AP Analysis and AP Aging cover what you are owed and what you owe, split into current and overdue, with links through to the underlying invoices and bills.
How do you customize which sections appear?
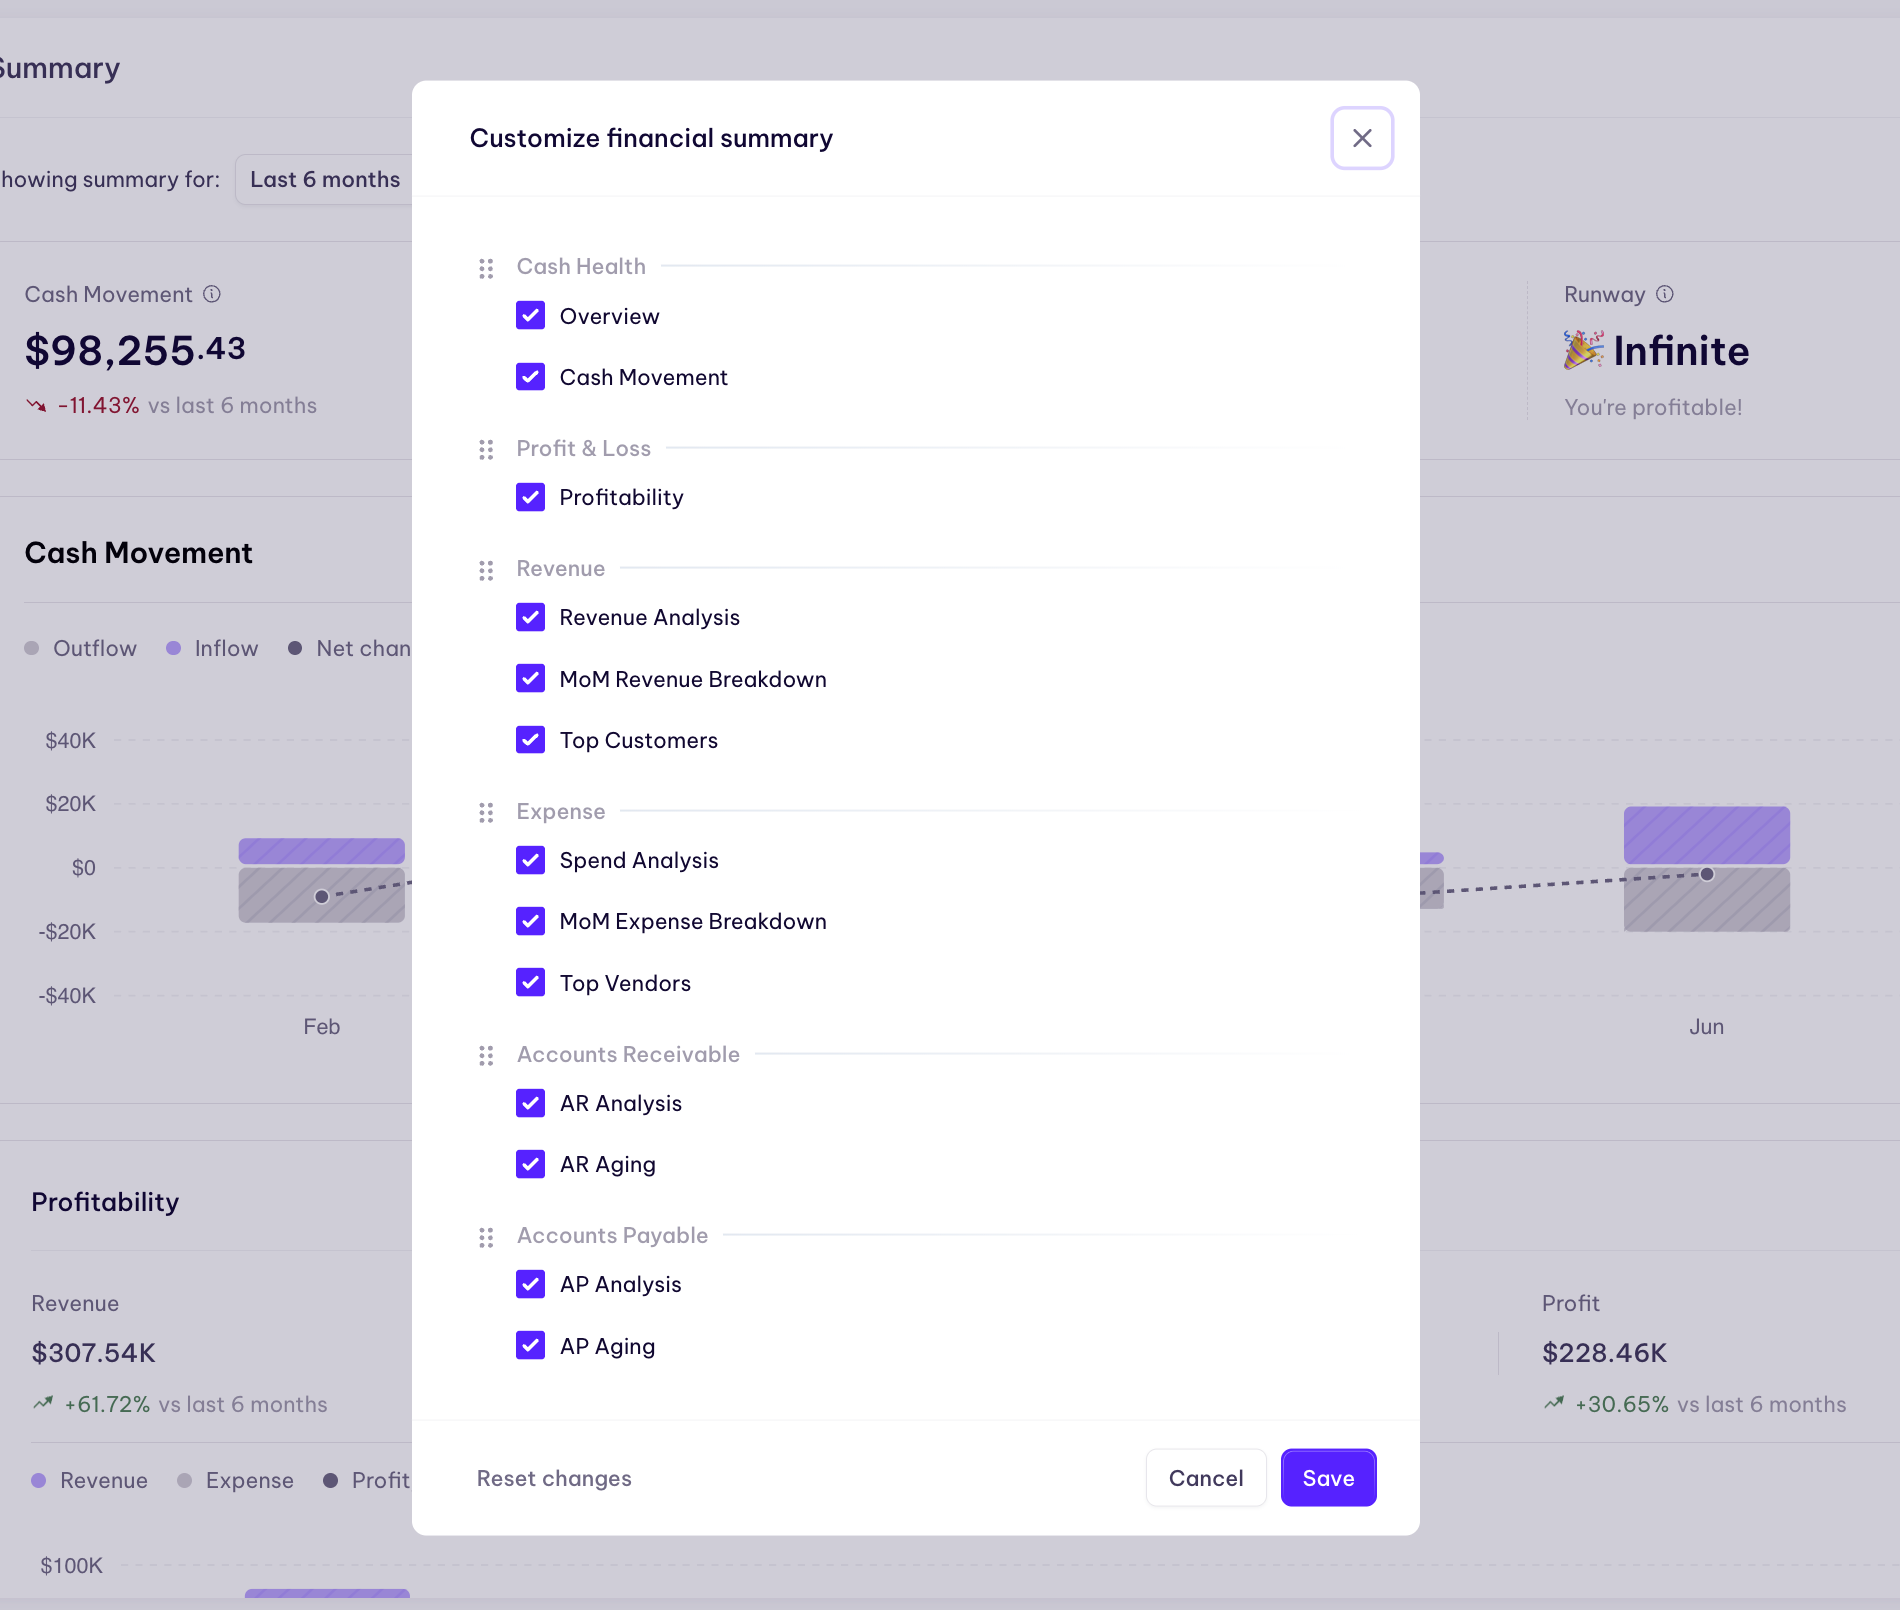
- On the Summary tab, select the Customize icon in the top right of the page
- The Customize financial summary window opens with every available section listed under its group: Overview, Profit & Loss, Revenue, Expense, Accounts Receivable and Accounts Payable
- Tick the sections you want and untick the ones you do not need
- Drag a group by its handle to change the order it appears in on the dashboard
- Select Save
Your dashboard rebuilds immediately. If you want to start over, Reset changes returns everything to the default selection.
How do you export Live Financials?
Exporting the Summary
Select the export icon in the top right of the Summary tab. It exports your current view, so whatever you have selected in Customize and whichever period you have chosen is what lands in the file. If the export is missing a chart you expected, open Customize, switch that section on, then export again.
Exporting a statement
The Balance Sheet, Income Statement and Cash Flow Statement tabs each have their own Export button. Before you use it, set the options along the top of the page:
- View by to group the report
- Filters to narrow what is included
- Date range for the reporting period
- Accounting method, accrual or cash
- Hide zero balances to drop empty lines from the output
Save keeps that combination of settings so you do not have to rebuild it next time.
Exporting several reports together
For a bundle rather than a single view, use All Reports in the left navigation. Set your date range and accounting method once at the top, then download a Consolidated Report (any combination of Balance Sheet, Income Statement, Aging Summaries and Revenue Recognition as one PDF or Excel file), a Reconciliation Report, or an AI-generated Financial Review.
Why might your numbers look different from your bank?
These figures are built from your transactions, so they are accurate up to the point your bookkeeping is current. The usual explanations for a gap:
- Uncategorised transactions. Anything still sitting as uncategorised income or expense is not counted as revenue or expense, which skews burn rate and runway
- A data source that has stopped syncing. Check Data Sources for any connection flagged as disconnected, since a stale feed means a stale balance
- An unreconciled period. Reconciliation is what confirms your book balance matches the statement balance
- A period that has not been closed. Accruals, deferrals and depreciation are booked during financial closing, so they are not yet reflected before it
Working through these is the same job as closing your books, so a monthly cadence keeps the dashboard trustworthy without any separate effort.
Frequently asked questions
Does the export include everything, or only what is on screen?
Only what is on screen. The export follows your current view, so use Customize first to add or remove sections, then export.
Can I change the time period on the Summary tab?
Yes. Use the Showing summary for dropdown at the top of the page. The date range beside it confirms the exact window being measured.
Why does my runway say Infinite?
Because your revenue is covering your burn for the selected period, so there is no rate at which your cash depletes. Inkle Books shows this as Infinite with a note that you are profitable.
Where do AR Aging, AP Aging and Vendor Summary live?
Under the Others tab in Live Financials, alongside any custom reports you have saved.
What is the Business Review tab for?
It holds your Financial Review once you generate one. Until then it prompts you to generate one to get started.
Can I export the Balance Sheet on a cash basis instead of accrual?
Yes. Switch the accounting method along the top of the tab before exporting.
How do I keep my report settings for next time?
Use Save on the statement tabs to store your combination of view, filters, date range and accounting method.
Still have questions?
Reach out to our support team if you have any additional questions regarding filing.