How do I run a flux analysis in Inkle Books?
Watch how to run a flux analysis here
Go to Reports, open Financial Closing, and click Generate Flux on the period you want. Inkle AI compares that period's Income Statement against the one before it, then writes an explanation for every line that moved, down to the vendors behind the movement. The work it replaces is the part that normally starts after you spot a variance: opening the general ledger, filtering by category, and reconstructing what happened.
Where to find it: Inkle Books → Reports → Financial Closing → Flux column
What flux analysis is
Flux is short for fluctuation. A flux analysis compares a financial statement across two periods, flags every line that moved materially, and records why it moved. Compare, flag, explain.
Auditors do this at the start of an engagement because they cannot test every transaction and need to know where to look. A line that moved 4% is probably fine. A line that moved 60% is either a real change in the business or an error in the books, and both deserve attention.
The same logic applies to a monthly close. You cannot review 800 transactions, so you need a reliable way to find the ten that matter.
Variances usually sort into three kinds, and the kind determines what you do next. Timing variances are spend that was always coming and happened to land in this period, like an annual premium or a late vendor invoice. They reverse themselves and need no action beyond an explanation. One-time variances are real but non-recurring, like legal fees for a financing, and should be stripped out when you talk about run rate. Structural variances mean the shape of the business changed, like a cloud bill rising because usage is rising. Those are the ones worth your attention, and the ones most easily buried in timing noise.
What the Flux column shows
Each row in the Financial Closing table is a period, with its closing method and status. The Flux column shows one of two buttons:
Generate Flux means no report exists yet for that period. Clicking it runs the analysis.
View Flux means a report has already been generated. Clicking it opens the report.
Generating a report
- Open Inkle Books and go to Reports in the left sidebar.
- Select Financial Closing.
- Find the period you want in the table.
- Click Generate Flux in the Flux column for that row.
- When the report is ready, the button becomes View Flux. Click it to open the report.
Inkle picks the comparison period for you: the period immediately before the one you selected. The report header shows both date ranges so you can see what is being compared against what.
Reading the report
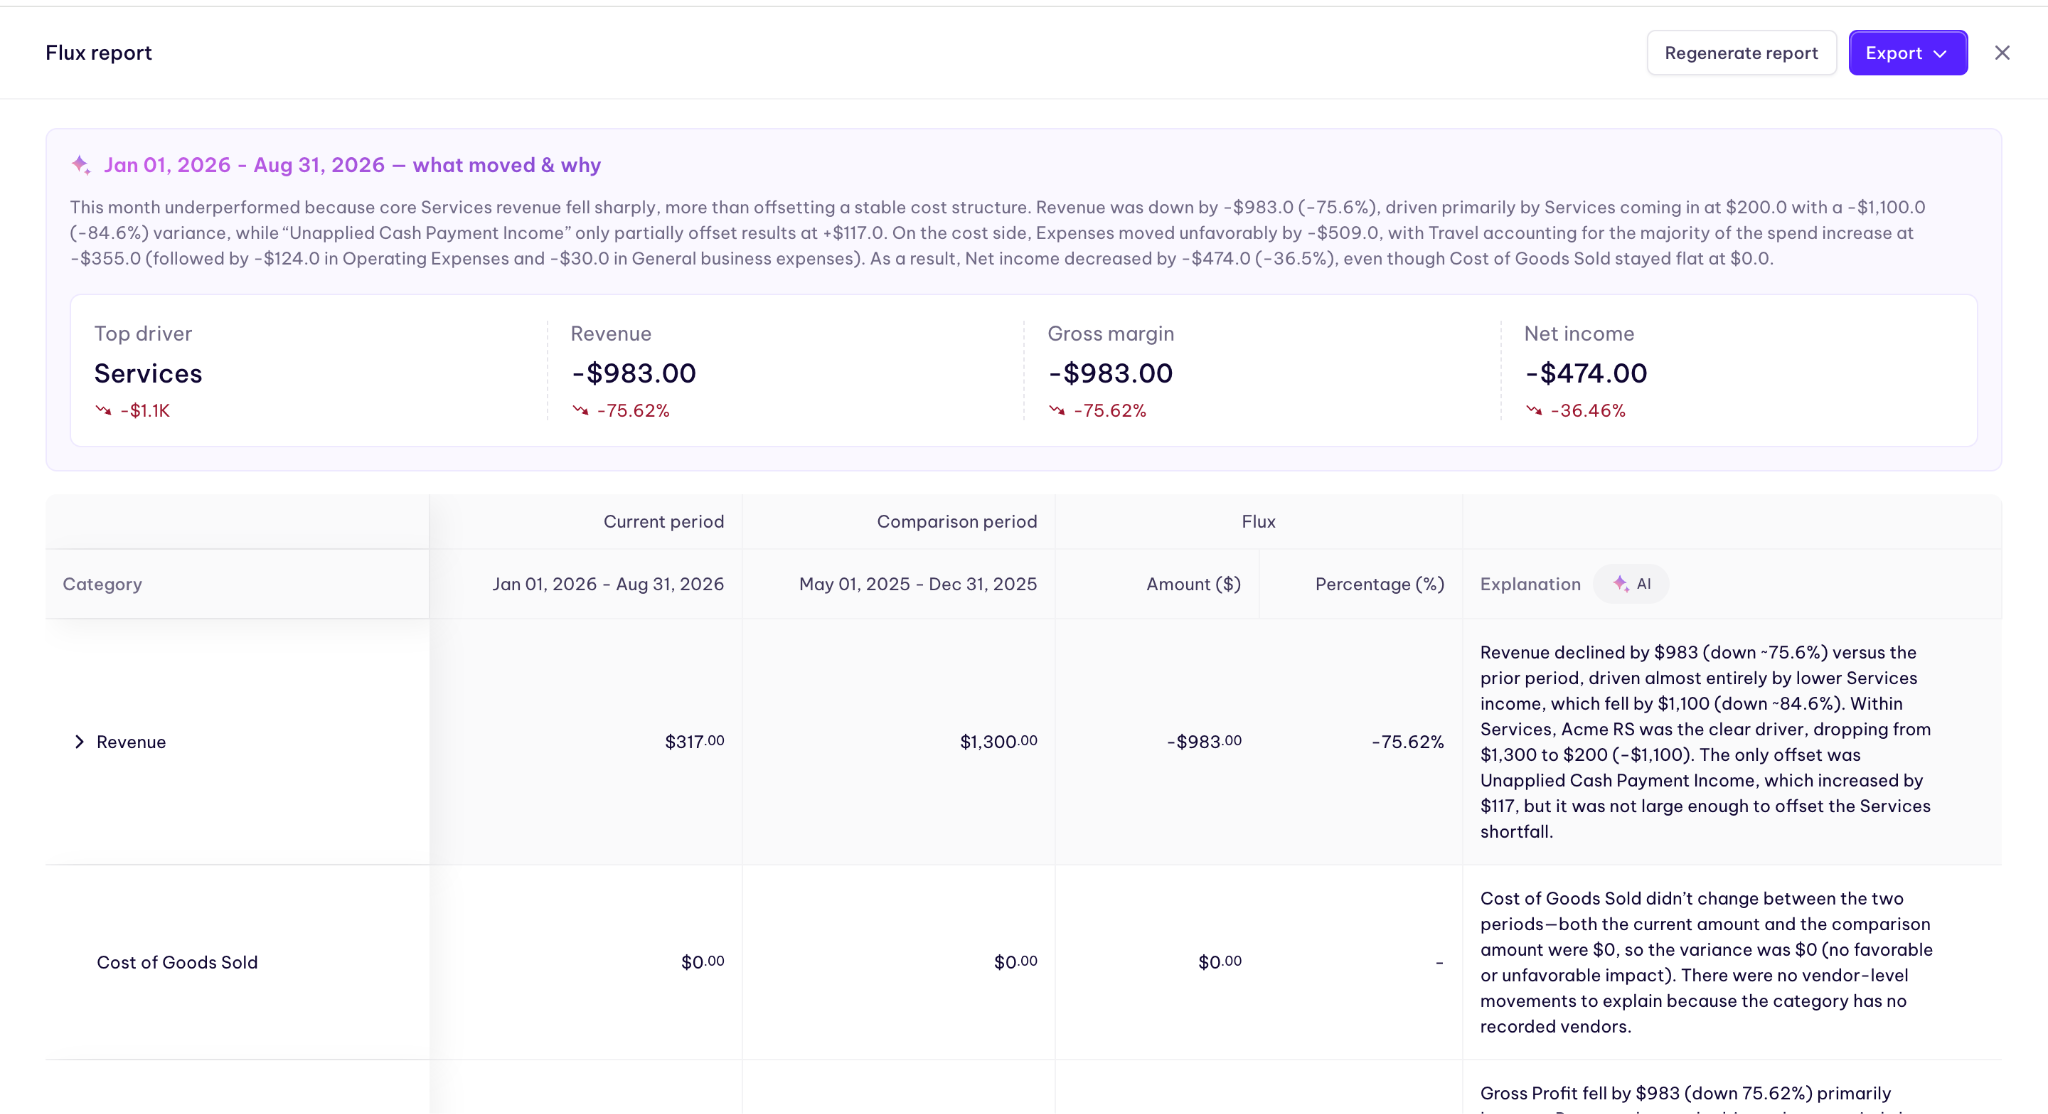
The report opens with a written summary of the period under the heading "what moved & why". It reads as prose rather than a list, and it names the main favorable and unfavorable drivers and whether the period looks like a timing story or an operating one.
Below the summary are four headline figures: Top driver, the single line that moved the report most, Revenue, Gross margin, and Net income, each with its change against the comparison period.
The table underneath covers the major parts of the Income Statement: Revenue, Cost of Goods Sold, Gross Profit, Expense, Net Operating Income, Other Income and Other Expense. Its columns are:
Category is the line item. Rows with a chevron expand to show the sub-categories underneath.
Current period and Comparison period are the two amounts, with the date range of each in the column header.
Flux splits into Amount ($) and Percentage (%), the change between the two periods in absolute and relative terms.
Explanation is the AI-written commentary for that line. It states the size of the move, the sub-categories and vendors driving it, and a read on whether it looks like timing, a one-off, or a run-rate change.
The explanations are written to go past the headline number. A 200% jump in a small account is often irrelevant, while a smaller percentage move in a large one can matter a great deal, so the analysis traces each movement to the vendors underneath it rather than ranking lines by percentage.
If you want the analysis rerun, for example after posting a correction to the period, use Regenerate report at the top of the report.
Exporting a report
Click Export at the top right of the report to open the Export Flux Analysis window. The period is fixed to the report you are in, and three toggles control what goes into the file:
Flux Summary includes the written period summary, with all categories.
Income Statement includes the full variance table, with all categories.
Vendor-Breakdown adds a separate tab. Turn it on and select the categories you care about, and that tab lists each vendor in those categories with its current period amount, prior period amount, and variance.
The vendor tab is the one to use for a recurring expense review. If you always look closely at, say, software and app expenses and influencer marketing, selecting those two gives you the vendor detail behind them without opening the general ledger separately.
Click Export to download, or Cancel to go back to the report.
What is not in it yet
Flux Analysis currently covers the Income Statement. The Balance Sheet is not included.
Materiality thresholds are not configurable yet, so you cannot set your own percentage and dollar cut-offs for what gets flagged. Editing explanations inside the app and sharing a report directly with a board or auditor are also on the way. For now, exporting is how a report leaves Inkle.
FAQ
Can I generate a report for a quarter or a year?
Yes, any number of months can be selected from the financial closing. so for a full financial calendar year, one may select Jan - Dec
Does generating a report change anything in my books?
No. It reads your closed financials and produces a report. It does not post entries or recategorize transactions.
Can it flag bookkeeping errors?
Often, yes. Miscategorized transactions, duplicate bills, and a vendor booked to the wrong account are hard to see in a transaction list and obvious in a period-over-period comparison.
Do my books need to be closed first?
A flux analysis is only as good as the data under it, so run it on a period whose transactions are categorized and reconciled. You can generate a report on a period still marked Ongoing, but expect the explanations to change once the close is finished. Regenerate after closing.
Can I change the comparison period?
Not yet, it automatically selects previous months according to the length of current period.
Which period does the report compare against?
If current period selected is Jun - Aug 2026 then it will be compared against Mar - May 2026
Still have questions?
Reach out to our support team if you have any additional questions regarding filing.