Flux analysis, explained for founders who have never sat in an audit



You open last month's P&L. Marketing is up 38%. You stare at it for a second, decide it was probably the conference, and move on.
That guess might be right. It might also be hiding a duplicate invoice, a subscription that auto-upgraded, or a genuine shift in how you acquire customers that you should be doubling down on. You do not know, because you did not check. And you did not check because checking means opening the general ledger, filtering by category, comparing two months line by line, and reconstructing the story from memory.
There is a name for doing that properly. Auditors call it flux analysis. It is one of the most useful financial habits a founder can steal from the audit world, and almost nobody outside accounting has heard of it.
What flux analysis actually is
Flux is short for fluctuation. Flux analysis is the practice of comparing a financial statement across two periods, identifying every line that moved materially, and writing down why it moved.
That is the whole thing. Compare, flag, explain.
Auditors do this at the start of an engagement, and they do it for a specific reason: they cannot test every transaction, so they need to know where to look. A line that moved 4% is probably fine. A line that moved 60% is either a real change in the business or a mistake in the books, and either way it deserves attention. Flux analysis is how an auditor decides where to spend their time.
Founders have exactly the same problem. You cannot review 800 transactions a month. You need a way to find the ten that matter.
Why the audit framing has held founders back
Flux analysis arrives wrapped in language that makes it sound like a compliance chore. Analytical review procedures. Materiality thresholds. Expectation setting. It reads like something you do because a regulator makes you.
Strip that away and what you have is a monthly forcing function that asks one question about every part of your business: what changed, and do you know why?
Answering that question is how you learn your own P&L. It is also how you catch problems while they are still small. A vendor that quietly moved from $400 a month to $1,900 a month shows up in a flux review in week one. Without one, it shows up when someone finally asks why gross margin has been sliding for a quarter.
Materiality: the part people get wrong
The first thing you need is a rule for what counts as worth explaining. Get this wrong and flux analysis becomes either useless or unbearable.
Use two thresholds together, not one.
A percentage-only rule breaks on small line items. Your bank fees went from $80 to $210. That is a 163% swing and it means nothing. If you flag it, you will spend your review chasing noise, and within two months you will stop doing the review.
A dollar-only rule breaks in the other direction. Your payroll moved by $9,000 on a $300,000 base. In absolute terms that is your biggest mover. In reality it is a normal month.
So the rule is: flag a line if it moved more than X% and more than $Y. For an early stage company, something like 15% and $2,000 is a sensible starting point. Tune it until you are flagging somewhere between eight and fifteen lines a month. Fewer than that and your thresholds are too loose to be useful. More and you will not finish.
What a real variance commentary looks like
This is where most attempts fall apart. People write down the number they already saw on the statement and call it an explanation.
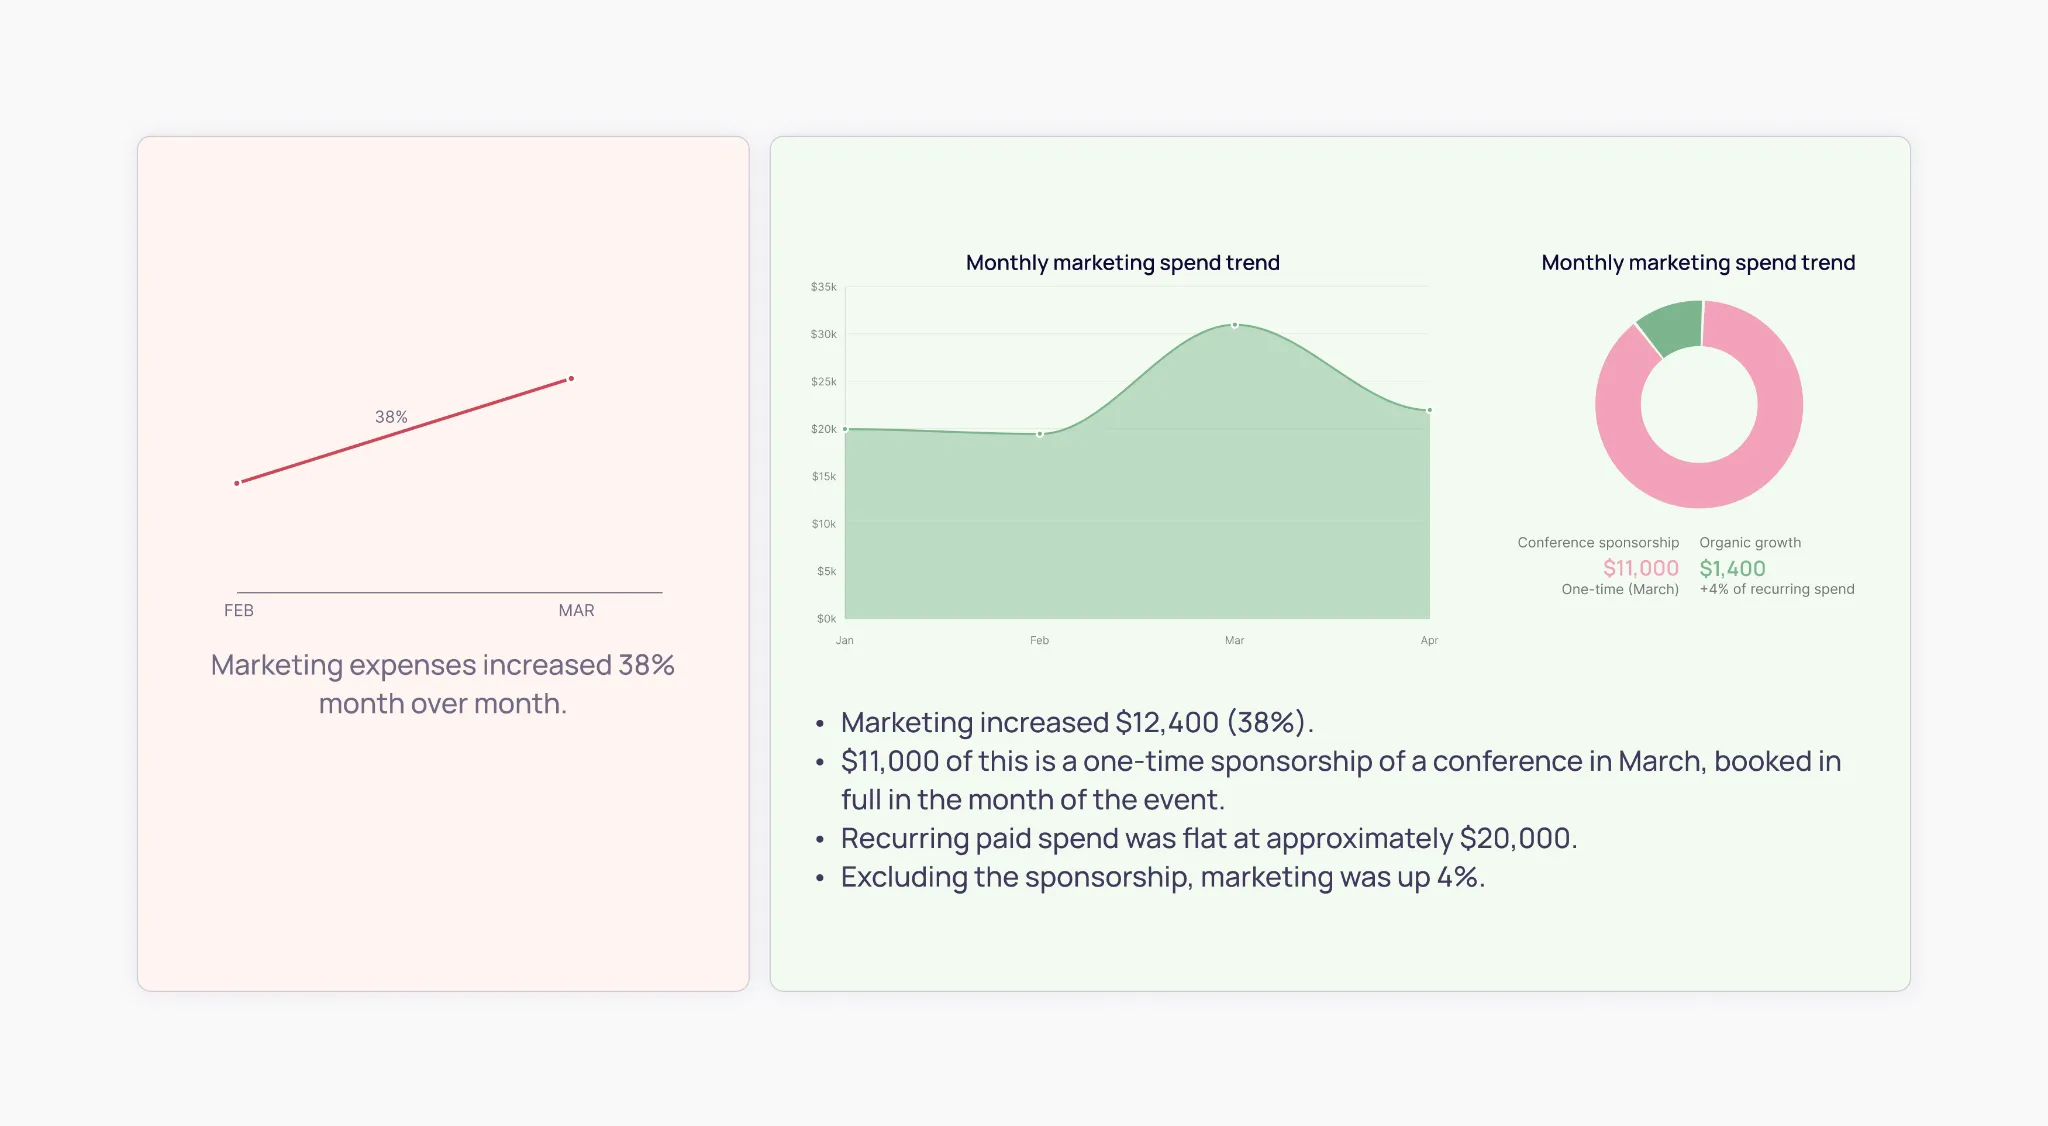
The second version tells you three things the first one does not: what the driver was, whether it repeats, and what the underlying trend looks like once you strip the noise out. That last part is the actual insight. Your marketing spend did not go up 38%. It went up 4% and you bought a booth.
Good commentary answers: what moved, how much of the move each driver accounts for, and whether it happens again.
The three kinds of variance
Once you have written enough of these, every variance sorts into one of three buckets, and the bucket determines what you do about it.
Timing. The money was always going to be spent, it just landed in this month instead of last. An annual insurance premium. A vendor who invoiced late. Two payroll runs in a month with three Fridays. Timing variances reverse themselves. They need explaining so nobody panics, but they need no action.
One-time. Real spend, genuinely non-recurring. Legal fees for a financing. Equipment for a new hire. A conference sponsorship. These matter for the month and should be excluded when you talk about run rate.
Structural. The shape of the business changed. Your cloud bill is up because usage is up and it will keep climbing. Your gross margin fell because your customer mix shifted toward a heavier-to-serve segment. Structural variances are the ones worth a founder's attention, and they are the ones most easily lost in a pile of timing noise.
The point of sorting variances is that it separates the noise from the signal, and it is the signal that changes what you do next.
What it unlocks
Once you are producing variance commentary every month, a few things get easier at once.
Board meetings. The most common failure mode in a board deck is a financials slide the founder cannot narrate. Every material line already has a written explanation attached. You are reading, not improvising.
Forecasting. A forecast built on a P&L you have not decomposed is a forecast built on averages, and averages carry every one-time item forward as though it recurs. Once your variances are tagged, you know which numbers to project and which to strip out.
Diligence. In a raise or an acquisition, someone will ask why a line moved eighteen months ago. Having that answer written down at the time, rather than reconstructed under pressure, is the difference between a smooth data room and a bad week.
Error detection. This is the underrated one. A flux review catches bookkeeping mistakes at least as often as it catches business changes. Miscategorized transactions, duplicate bills, a vendor booked to the wrong account. These are invisible in a transaction list and obvious in a period-over-period comparison.
The honest version of doing this manually
It takes about two hours a month, assuming your books are already closed and clean.
You export the current and prior period P&L. You put them side by side and compute the deltas in both dollars and percent. You apply your thresholds. For each flagged line you drill into the general ledger, find the transactions driving the move, work out which are timing and which are structural, and write it up. Then you do the same for the balance sheet, where the drivers are harder to see and the mistakes are more expensive.
Two hours is not a lot. But it is two hours in the same week you are closing a round, shipping a release, or hiring. It is the first thing to get skipped, and once it is skipped twice it stops being a habit.
How we handle it in Inkle Books
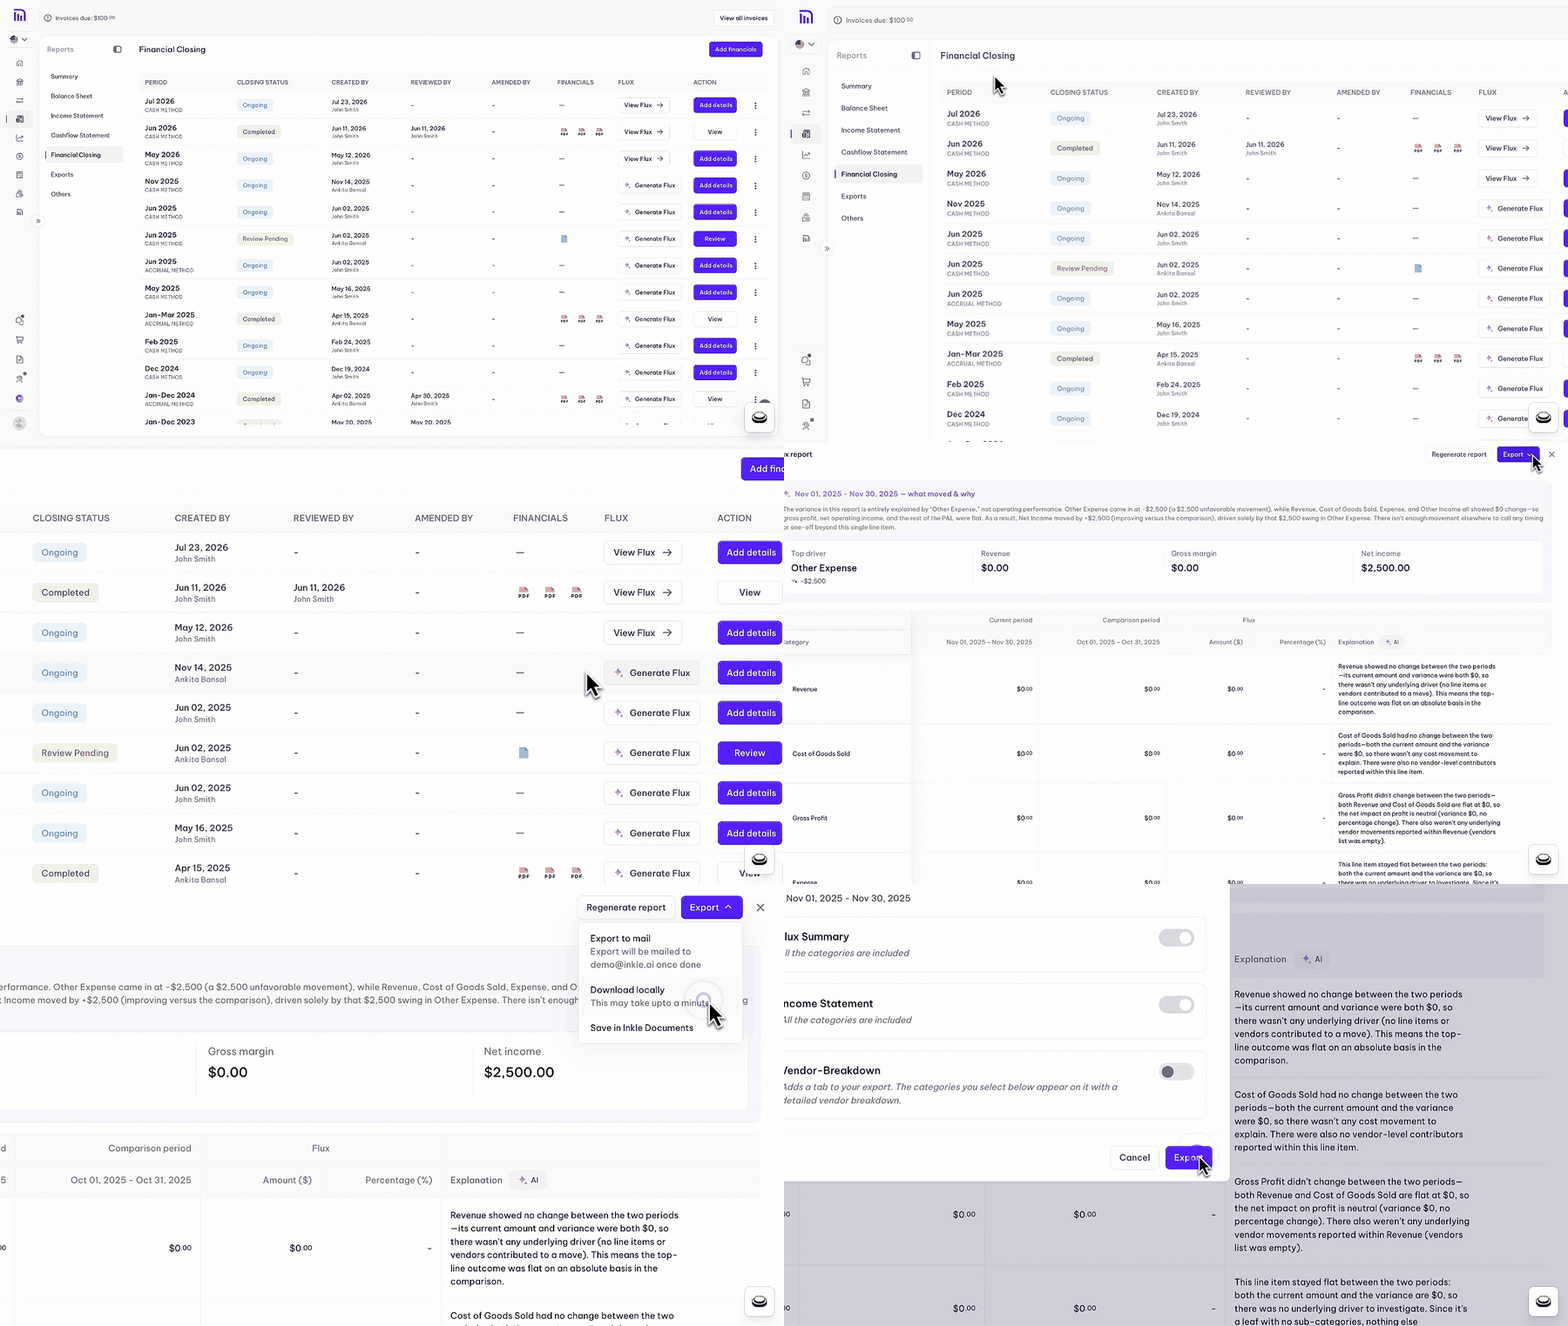
Flux Analysis is now live for Income Statements, inside Financial Closing. When you generate a Flux Report for close, Inkle AI compares the close period against the one before it and does the work that normally starts after you spot a variance: it investigates what is actually behind the movement.
The important part is that it does not stop at identifying the line that changed. A 200% jump in a small account might be irrelevant, while a much smaller percentage movement elsewhere could have a significant impact on the business. Inkle AI looks past the headline variance and traces the movement down to the vendors driving it.
The output starts with a short summary of the period, followed by explanations across the major parts of the Income Statement: Revenue, COGS, Gross Profit, Expenses and Net Income. The goal is to give you a starting point that is already closer to an answer than a list of variances: not just what changed, but what caused it.
One of our customers, for example, always wants to look more closely at Software and App Expenses and Influencer Marketing as part of their expense audit. When exporting a flux report, they can add a vendor-level breakdown for those specific categories, showing the current period, prior period and variance for each vendor. That makes it easy to move from a high-level variance to the actual vendors behind the spend, without having to dig through the general ledger separately.
We are also working on in-app editing of flux explanations, shareable flux reports for boards and auditors, and configurable materiality thresholds so the analysis can be tuned to what is actually meaningful.
Start here
If you take one thing from this, take the habit rather than the tooling. Open your last two months, set a threshold, pick your five biggest movers, and write a sentence about each that a stranger could understand.
You will learn something about your business in the first ten minutes. That is the whole case for flux analysis, and it has nothing to do with audits.
Flux Analysis is available in Inkle Books. If you want to see what your last close would have looked like with it, get in touch.